Главная страница Случайная страница
КАТЕГОРИИ:
АвтомобилиАстрономияБиологияГеографияДом и садДругие языкиДругоеИнформатикаИсторияКультураЛитератураЛогикаМатематикаМедицинаМеталлургияМеханикаОбразованиеОхрана трудаПедагогикаПолитикаПравоПсихологияРелигияРиторикаСоциологияСпортСтроительствоТехнологияТуризмФизикаФилософияФинансыХимияЧерчениеЭкологияЭкономикаЭлектроника
Average fixed costs
|
|
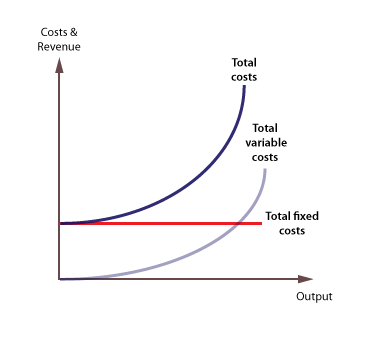
Fixed and variable costs
Fixed costs are those that do not vary with output and typically include rents, insurance, depreciation, set-up costs, and normal profit. They are also called overheads.
Variable costs are costs that do vary with output, and they are also called direct costs. Examples of typical variable costs include fuel, raw materials, and some labour costs.
An example
Consider the following hypothetical example of a boat building firm. The total fixed costs, TFC, include premises, machinery and equipment needed to construct boats, and are £ 100, 000, irrespective of how many boats are produced. Total variable costs (TVC) will increase as output increases.
| |||||||||||||||||||||||||||||||||||||
Plotting this gives us Total Cost, Total Variable Cost, and Total Fixed Cost.
Video
Total fixed costs
Given that total fixed costs (TFC) are constant as output increases, the curve is a horizontal line on the cost graph.
Total variable costs
The total variable cost (TVC) curve slopes up at an accelerating rate, reflecting the law of diminishing marginal returns.
Total costs
The total cost (TC) curve is found by adding total fixed and total variable costs. Its position reflects the amount of fixed costs, and its gradient reflects variable costs.
Average fixed costs
Average fixed costs are found by dividing total fixed costs by output. As fixed cost is divided by an increasing output, average fixed costs will continue to fall.
| ||||||||||||||||||||||||||||

The average fixed cost (AFC) curve will slope down continuously, from left to right.