Главная страница Случайная страница
КАТЕГОРИИ:
АвтомобилиАстрономияБиологияГеографияДом и садДругие языкиДругоеИнформатикаИсторияКультураЛитератураЛогикаМатематикаМедицинаМеталлургияМеханикаОбразованиеОхрана трудаПедагогикаПолитикаПравоПсихологияРелигияРиторикаСоциологияСпортСтроительствоТехнологияТуризмФизикаФилософияФинансыХимияЧерчениеЭкологияЭкономикаЭлектроника
GDP: purchasing power parity
|
|
(billion $, 2013)
Indonesia is the leader on this indicator. The government has promoted fiscally conservative policies, resulting in a debt-to-GDP ratio of less than 25% and historically low rates of inflation. Indonesia still struggles with poverty and unemployment, inadequate infrastructure, corruption, a complex regulatory environment, and unequal resource distribution among regions. The government also faces the challenges of quelling labor unrest and reducing fuel subsidies in the face of high oil prices.
Libya has the lowest level of GDP. Libya's economy is structured primarily around the nation's energy sector, which generates about 95% of export earnings, 80% of GDP, and 99% of government income.
 GDP - PER CAPITA (PPP):
($, 2013)
Oil and gas have made Qatar the world's highest per-capita income country and the country with the lowest unemployment. Proved oil reserves in excess of 25 billion barrels should enable continued output at current levels for about 57 years.
Nigeria has the lowest rate of what??? growth rate?? Where??. Oil has been a dominant source of government revenues since the 1970s over. 62% of Nigeria's 170 million people live in extreme poverty.
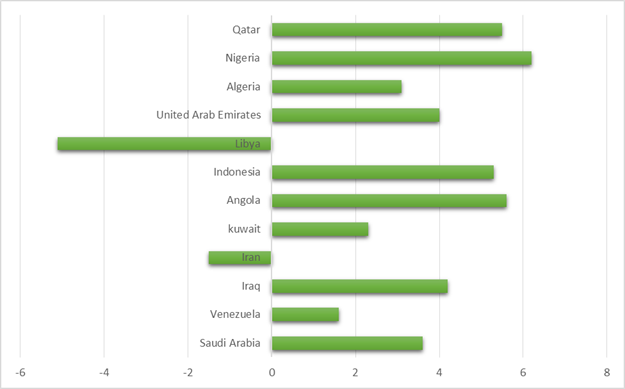 GDP - REAL GROWTH RATE:
(%, 2013)
Nevertheless, the Nigerian economy has continued to grow at a rapid 6-8% per annum (pre-rebasing), driven by growth in agriculture, telecommunications, and services, and the medium-term outlook for Nigeria is good, assuming oil output stabilizes and oil prices remain strong.
Iran has a negative growth rate. Iran's economy is marked by statist policies, an inefficient state sector, and reliance on oil, a major source of government revenues. Price controls, subsidies, and other distortions weigh down the economy, undermining the potential for private-sector-led growth.
 GDP - COMPOSITION, BY SECTOR OF ORIGIN: (%, 2013)
Angola's high growth rate in recent years was driven by high international prices for its oil. Oil production and its supporting activities contribute about 85% of GDP. Diamond exports contribute an additional 5%. Algeria's economy remains dominated by the state. Hydrocarbons have long been the backbone of the economy, accounting for roughly 60% of budget revenues, 30% of GDP, and over 95% of export earnings.
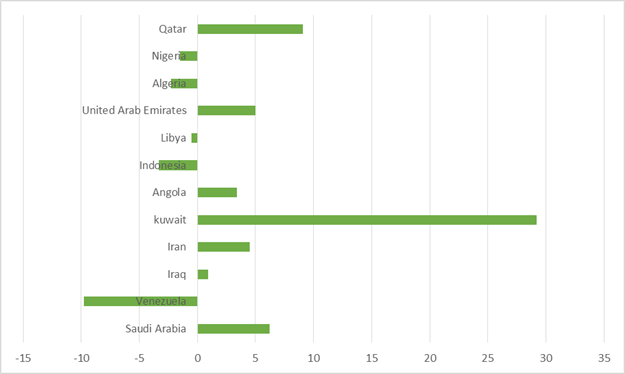 BUDGET SURPLUS (+) OR DEFICIT (-):
(%, 2013)
Kuwait among all OPEC countries has the highest budget surplus. Kuwait has a geographically small, but wealthy, relatively open economy with crude oil reserves of about 102 billion barrels - more than 6% of world reserves. Budget surpluses have stayed around 30% of GDP, which has led to higher budget expenditures, particularly wage hikes for many public sector employees, as well as increased allotments to Kuwait’s Future Generations Fund.
 INFLATION RATE (CONSUMER PRICES): (%, 2013)
Venezuela has the highest rate of budget deficit. Venezuela remains highly dependent on oil revenues, which account for roughly 96% of export earnings, about 45% of budget revenues, and around 12% of GDP. Venezuela is a major oil exporter, because of centralized control over prices in the country there was a shortage of basic goods. Issue of the national currency led to high inflation.
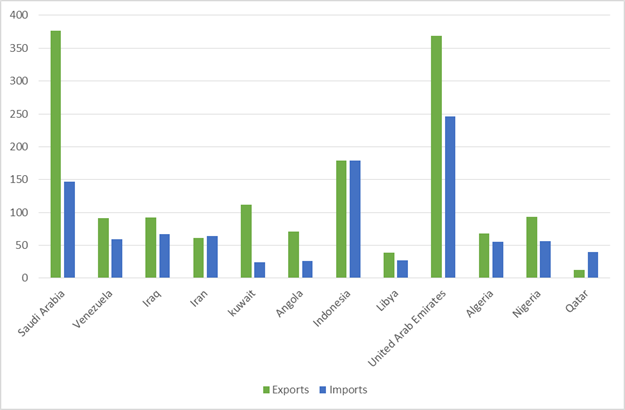 Exports and imports ($ billion, 2013)
Saudi Arabia has an oil-based economy with strong government controls over major economic activities.
It possesses about 16% of the world's proven petroleum reserves, ranks as the largest exporter of petroleum, and plays a leading role in OPEC. The petroleum sector accounts for roughly 80% of budget revenues, 45% of GDP, and 90% of export earnings.
The UAE has an open economy with a high per capita income and a sizable annual trade surplus.Successful efforts at economic diversification have reduced the portion of GDP based on oil and gas output to 25%.Since the discovery of oil in the UAE more than 30 years ago, the country has undergone a profound transformation from an impoverished region of small desert principalities to a modern state with a high standard of living.
RUSSIA'S PLACE ON THE GLOBAL OIL MARKET
On the global oil market Russia ranks third (10.44 million bbl/day). Top position belongs to the US with the production of 12.4 million barrels of oil per day. Next is Saudi Arabia - 11.6 million barrels.

OIL PRICE DYNAMICS AND FORECAST
Since March 2012 until 2014 oil price amounted to 108-110 dollars per barrel. Recent events showed a strong decline in oil prices in 2014, when the index value dropped to $ 56. The reluctance of OPEC countries to make concessions to Russia, the discovery of oil exports USA will contribute to a long oil price??? retention.
Thus, all eleven countries are in trouble depending on the income of their oil industries. The only exception is Indonesia, which receives significant revenues from tourism, forests, and sale of gas and other raw materials. For the rest of OPEC countries, the level of dependence on oil exports varies from a low of 45% in the case of the United Arab Emirates to 97% in Algeria.