Главная страница Случайная страница
КАТЕГОРИИ:
АвтомобилиАстрономияБиологияГеографияДом и садДругие языкиДругоеИнформатикаИсторияКультураЛитератураЛогикаМатематикаМедицинаМеталлургияМеханикаОбразованиеОхрана трудаПедагогикаПолитикаПравоПсихологияРелигияРиторикаСоциологияСпортСтроительствоТехнологияТуризмФизикаФилософияФинансыХимияЧерчениеЭкологияЭкономикаЭлектроника
Methods of Examination 4 страница
|
|
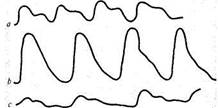
Pulse character (Fig. 37a). This depends on the rate of change in the arterial pressure during systole and diastole. If much blood is discharged into the aorta during systole and the pressure in the aorta increases rapidly, while during a diastole this pressure quickly falls, the arterial wall will expand and collapse quickly as well. This pulse is called quick pulse (pulsus celer or pulsus saliens). On a sphygmogram this pulse gives a steeper anacrotic rise and sharp catacrotic fall (Fig. 376). Quick pulse is characteristic of aortic incompetence, since in this condition the stroke volume and systolic pressure increase, while during diastole the pressure falls rapidly due to blood regurgitation into the left ventricle. Pulse in such cases is not only quick but also high (pulsus celer et altus). Quick pulse is less characteristic of thyrotoxicosis or nervous strain.
Slow pulse (pulsus tardus) is, on the contrary, connected with slow rise and fall of pressure in the arterial system and its small fluctuation during
|
Fig. 37. Sphygmograms. a —normal pulse; b —quick and high pulse; c —small and low pulse.
the cardiac cycle (Fig. 37c). This condition is characteristic of aortic stenosis: blood ejection from the left ventricle is difficult and the pressure in the aorta therefore increases slowly. The pulse wave decreases and the pulse is therefore not only slow but also small (pulsus tardus et parvus).
Other changes in the arterial pulse. Sometimes, when the pulse wave decreases, another wave can be detected which is connected with increasing dicrotic wave; this wave normally is not detectable and can only be seen on a sphygmogram. If the tone of the peripheral arteries decreases (e.g. in fever or infectious diseases), the dicrotic wave can be detected by palpation as well. This pulse is called dicrotic (pulsus dicroticus). Paradoxical pulse (pulsus paradoxus) is also distinguished. It is characterized by smaller pulse waves during inspiration. It develops in cases with adherent pericardium due to compression of large veins and decreased blood filling of the heart during inspiration.
After the examination of pulse on the radial artery has been finished, it is studied on other vessels, e.g. on the temporal, carotid, femoral, popliteal arteries, dorsalis pedis and other arteries. Examination of pulse on other arteries is especially important in suspected affections of these arteries (obliterating endocarditis, atherosclerosis, thrombosis of the vessels).
The femoral artery is readily palpable in the groin, better with the straightened and slightly outwardly turned thigh. The pulse of the popliteal artery is well palpated in the popliteal fossa with the patient in the prone position. The posterior tibial artery is palpated in the region of the condyle of the internal malleolus. The dorsalis pedis artery is felt on the dorsal surface of the foot in the proximal part of the first intermetatarsal space. The pulse taken on the latter two arteries is very important for diagnosis of obliterating endarteritis.
The pulse of the carotid arteries should be examined carefully, one after the other, beginning with a slight pressure on the arterial wall, because of the danger of the carotid reflex: the heart may slow down markedly (or even stop) and the arterial pressure drop significantly. The clinical signs of this reflex are vertigo, faint, and convulsions.
15-1556
Special Part
Chapter 6. Blood Circulatory System
Some diseases of the cardiovascular system are characterized by different pulse in the upper and lower extremities. When the aortic isthmus is constricted (coarctation), the pulse waves in the lower extremities decrease significantly, whereas they remain normal, or even increase, in the carotid arteries and the arteries of the upper extremities. In Takayasu's disease (pulseless disease), in the presence of obliterating arteritis of large vessels originating from the aortic arch, the pulse decreases or disappears at all in the carotid, axillary, brachial, and radiant arteries.
Velocity of the pulse wave. An additional method of examination of the arterial system is determining velocity at which the pulse wave is propagated; this is used to assess the elasticity of the vascular walls. The firmer the wall, the higher the velocity at which the pulse wave is propagated.
In order to determine velocity of pulse wave propagation (V), it is necessary to know the length of the vessel (L), and the pulse wave lag time (0 on the periphery at instantaneous sphygmography at two points of the vascular system. The pulse wave velocity can then be calculated from the formula:
V=T
In order to determine the velocity of pulse wave, two sphygmograms are usually taken synchronously from the carotid and femoral arteries (see " Sphygmography"). One pickup is placed at the bifurcation of the carotid artery (at the level of the upper thyroid cartilage) and the other, on the femoral artery, in the region of the inguinal ligament. A measuring tape is then used to measure the distance from the jugular fossa to the first pickup (/j) and to the second one (/j). The true length of the vessel (L) can be found by subtracting two lengths from the jugular fossa to the pickup on the carotid artery (2/j) from the sum of the lengths l{ and l2, because the direction in which the pulse wave propagates in the carotid artery is opposite to that in the aorta. It follows that/, = (/, + /! )-2x/1 = /2-/1. Once the length of the vessel is known, the lag time is now determined for the pulse wave at the periphery, i.e. the period lasting from the anacrotic ascent on the sphygmogram of the femoral artery to the anactrotic ascent on the carotid sphygmogram (in hundredth fractions of a second). The higher the velocity of pulse wave, the less the time lag.
Once the length and lag time of the pulse wave have been determined, one can find the velocity of the pulse wave mainly in the descending aorta. In normal cases it varies from 4.5 to 8 m/s. This velocity increases with age. It also increases in atherosclerosis and essential hypertension. The pulse wave velocity decreases in hypotension, anaemia, heart diseases, and thrombosis of the abdominal artery.
STUDY OF CAPILLARIES
Capillaries are examined by inspection and capillaroscopy.
Capillaroscopy is the method of studying capillaries of intact surface epithelial coats (e.g. skin or mucosa). Slight-magnification microscopes with common diffuse day-light illumination, or special capillaroscopes may be used for the purpose. Capillarography is a photographic modification of capillaroscopy. It gives graphic patterns.
Capillaroscopy is mostly used to study capillaries at the edge of the nail bed of the ring finger. In order to clarify the skin, it is coated with a drop of peach-kern or cedar oil. In normal conditions, the capillaries can be seen as elongated pale red loops against the yellowish pink background. The arterial bend of the capillary is normally narrower and shorter than the venous one; the transition part of the loop is usually rounded. Figure-eight-shaped loops sometimes occur. The number of capillaries is 16-20 in the field of vision. The blood flow is almost indiscernible in them; it is continuous and faster in the arterial bend than in the venous one. The capillaroscopic picture changes during vascular spasms, congestions, and in diabetes mellitus.
STUDY OF VENOUS PULSE
Venous pulse is studied by inspection and phlebography.
Phlebography is the recording of the venous pulse. Vibrations of the venous walls connected with the change in filling of the large veins located close to the heart are recorded in the form of a curve (phlebogram). The principle underlying phlebography is similar to that used in sphygmography. Phlebograms of the jugular veins, where the pulsation is more pronounced, are usually taken. A phlebogram of the cardiac cycle in healthy subjects includes a number of waves (Fig. 38). These are positive (a, c, v) and negative (x, y) pulse waves. Their origination is explained as follows.
1. The positive wave a appears during contraction of the right atrium.
At this moment, emptying of the venae cavae from the inflowing
peripheral venous blood is delayed; the veins become overfilled and
swollen.
2. Wave c follows wave a after an insignificant descent of the curve. It

|
Fig. 38. Phlebograms. /—normal; 2 —positive venous pulse.
Special Part
Chapter 6. Blood Circulatory System
is associated with ventricular systole and arises due to transmission of pulsation of the carotid artery that runs in the vicinity of the jugular vein.
3. Next follows the negative wave x, which is caused by a systolic col
lapse and is explained by filling of the right atrium with venous blood dur
ing ventricular systole; the veins are emptied and collapse. Fast emptying
of the veins is facilitated by the falling intrathoracic pressure due to heart
contraction and discharge of the systolic blood to the peripheral vessels.
4. Positive wave v comes at the end of the ventricular systole with the
closed tricuspid valve. It is connected with accumulation of blood in the
atria which holds back the delivery of new portions of blood from the
venae cavae.
5. Wave v is followed by a new collapse of the vein (the diastolic col
lapse y) which begins with opening of the tricuspid valve and delivery of
blood into the right ventricle. This promotes the inflow of blood from the
venae cavae into the right atrium and collapse of the vein.
In the analysis of a phlebogram, it is useful to pay attention to the shape and width of separate waves and their relation to the sphygmographic findings. A phlebogram shows the activity of the right heart chambers and pressure fluctuation in the right atrium. A normal phlebogram has a sharp wave a; this form of the venous pulse curve is called atrial. If sphygmogram and phlebogram are taken simultaneously, the maximum ascent of the normal sphygmographic curve corresponds to the negative deviation (x) of the phlebogram, because atrial diastole and blood flow into the atria from the veins begin during ventricular systole and blood ejection into the arterial system. Hence another name of a normal venous pulse, negative venous pulse.
The size of separate waves on phlebograms changes in pathology. The waves may increase, decrease, or disappear. For example, with difficult blood outflow from the right atrium (in stenotic right atrioventricular orifice, or increased pressure in the right ventricle), the contractile force of the atrium and the a wave increase. The a wave broadens and becomes lower, or it can even disappear altogether in progressive weakness of the right atrium, and blood congestion in it. Since the blood pressure does not fall significanlty during diastole either, emptying of the veins becomes difficult. The negative x wave therefore levels and disappears. As a result, the activity of the right ventricle can only be seen on the phlebogram: the vein swells during ventricular systole (positive v wave) and collapses during diastole (negative y wave). This form of the venous pulse is called ventricular.
If ventricular venous pulse is recorded synchronously with sphygmogram, one can see that the maximum ascent of the curve on the sphygmogram corresponds not to the systolic collapse of the vein but to the
positive deviation, the v wave. This explains another name of the pulse, positive venous pulse (see Fig. 38).
Positive ventricular venous pulse is observed in tricuspid incompetence, pronounced venous congestion in the greater circulation, in fibrillation and complete transverse heart block.
AUSCULTATION OF VESSELS
Auscultation of arteries. Arteries of medium calibre, such as the carotid, subclavian, or femoral artery, are usually auscultated. The artery is first palpated, then heard by a phonendoscope without applying pressure, since stenotic murmurs may otherwise appear. Sounds and murmurs can be heard over arteries. These can be generated either in the arteries themselves or be transmitted from the heart and aortic valves. The transmitted sounds and murmurs can only be heard on the arteries that are located close to the heart, such as the carotid and the subclavian arteries.
Two sounds can be heard on the carotid and subclavian arteries in healthy persons. The first sound is due to the tension of the arterial wall distended by the running pulse wave, and the second sound is transmitted onto these arteries from the aortic semilunar valve. One systolic sound can sometimes be heard on the femoral artery. Like the first sound of the carotid and subclavian arteries, the second sound is generated by the vibration of the tensed arterial wall when the pulse wave passes it. In aortic incompetence, the first sound over the arteries becomes louder because of the higher pulse wave, and it can be heard at greater distances from the heart, e.g. on the brachial and radial arteries. Two sounds can sometimes be heard on the femoral artery in aortic incompetence. This doubled tone (Traube's doubled tone) is generated by intense vibration of the vascular wall during both systole and diastole.
Sounds heard over the arteries are mostly systolic. Systolic sound produced by the stenosed aortal orifice is usually well transmitted onto the carotid and subclavian arteries. Systolic sound associated with decreased viscosity of blood and increased flow rate (e.g. in anaemia, fever, exophthalmic goitre) can also be heard on these vessels. Systolic sound sometimes appears in stenosis or aneurysmal dilation of large vessels. The Vinogradov-Duroziez doubled tone can be heard in aortic incompetence over the femoral artery when it is compressed by a stethoscope bell. The first of these tones is stenotic murmur, which is due to the blood flow through a narrowed (by the pressure of the stethoscope) vessel, while the second sound is explained by the accelerated backflow to the heart during diastole.
Special Part