Главная страница Случайная страница
КАТЕГОРИИ:
АвтомобилиАстрономияБиологияГеографияДом и садДругие языкиДругоеИнформатикаИсторияКультураЛитератураЛогикаМатематикаМедицинаМеталлургияМеханикаОбразованиеОхрана трудаПедагогикаПолитикаПравоПсихологияРелигияРиторикаСоциологияСпортСтроительствоТехнологияТуризмФизикаФилософияФинансыХимияЧерчениеЭкологияЭкономикаЭлектроника
Chapter 6. Blood Circulatory System
|
|
 Auscultation of veins. Neither sounds nor murmurs are normally heard over veins. Auscultation of the jugular veins, over which the so-called nun's murmur may be heard, is diagnostically important. This is a permanent blowing or humming sound, which is produced by accelerated flow of blood with decreased viscosity in anaemic patients. It is better heard on the right jugular vein and becomes more intense when the patient turns the head in the opposite side.
MEASURING ARTERIAL PRESSURE
The pressure of the blood in the arterial system varies rhythmically, attaining its maximum during systole and lowering during diastole. This is explained as follows: when blood is ejected during systole it meets resistance of the arterial walls and of the blood contained in the arterial system; the pressure in the arteries thus increases to cause distention of the arterial walls. During diastole the arterial pressure falls and remains at a certain level due to the elastic contraction of the arterial walls and resistance of the arterioles, owing to which the blood flow into the arterioles, capillaries, and veins continues. It follows therefore that arterial pressure is proportional to the amount of blood ejected by the heart into the aorta (i.e. the stroke volume) and the peripheral resistance.
Arterial pressure is expressed in millimetres of mercury column. The normal systolic (maximal) pressure varies from 100 to 140 mm Hg and diastolic (minimal) from 60 to 90 mm Hg. The difference between systolic and diastolic pressure is called the pulse pressure (normally it is 40—50 mm Hg). Arterial pressure can be measured by a direct or indirect method. In the direct method, the needle or a cannula is introduced directly into the artery and connected to a pressure gauge. This method is mostly used in heart surgery.
Three techniques exist to take blood pressure indirectly. These are auscultatory, palpatory, and oscillographic. The auscultatory method is commonly used in medical practice. The method was proposed by N. Kbrotkoff in 1905 and is used to measure systolic and diastolic blood pressure. A sphygmomanometer is used to read pressure. It consists of a mercury or a spring manometer which is connected to a cuff and rubber bulb used to inflate the cuff through a connecting tube. A valve on the bulb is used to admit air into the cuff and the manometer, and to hold pressure at the needed level. A more accurate instrument is a Riva-Rocci mercury manometer. This is a mercury container communicated with a thin vertical glass tube attached to a scale graduated in millimetres from 0 to 300.
The pressure in the brachial artery is usually measured. To that end, the
arm of the patient is freed from tight clothes and a cuff is attached snugly and evenly onto the arm (a finger-breadth between the cuff and the skin). The inlet socket of the cuff should be directed downward, 2-3 cm above the antecubital fossa. The arm should be placed comfortably on a level surface, the palm up; the muscles of the arm should be relaxed. The phonen-doscope bell is placed over the brachial artery in the antecubital space, the valve on the bulb is closed, the air is pumped into the cuff and the manometer. The pressure of the air in the cuff that compresses the artery corresponds to the mercury level as read off the instrument scale. Air is pumped into the cuff until pressure inside it is 30 mm above the level at which the brachial or radial artery stops pulsating. The valve is then opened slowly to release air from the cuff. Using the phonendoscope, the brachial artery is auscultated and the readings of the manometer followed. When the pressure in the cuff drops slightly below systolic, tones synchronous with the heart beats are heard. The manometer readings at the moment when the tones are first heard are taken as the systolic pressure. This value is usually recorded to an accuracy of 5 mm Hg (e.g. 135, 130, 125 mm Hg, etc.).
N. S. Korotkoff described four phases of sounds that are heard during measurement of arterial pressure. The first phase is the appearance of the tone over the artery. The tones arise at the moment when the pressure in the artery during systole becomes slightly above the pressure in the cuff and the first portions of blood pass into the vessel below the point of constriction to cause pulsation of the relaxed wall of the emptied vessel. Although the tones appear at a pressure slightly below the systolic one, this difference is insignificant and is disregarded. As air pressure in the cuff continues decreasing, greater amount of blood passes the compressed portion of the vessel and the pulsation of the arterial wall below the point of constriction intensifies. The tones become louder, and murmurs caused by the blood turbula-tion below the constricted point join the tones {secondphase). A further reduction of the air pressure inside the cuff decreases pressure on the artery and the sounds disappear. The tone loudness increases during this time because the pressure in the cuff still remains above diastolic. The artery below the point of compression remains relaxed, and since greater amounts of blood pass into the vessel during each systole, pulsation of the vessel is intensified and the tones become louder. The moment when loud tones become audible is designated as the third phase. When pressure inside the cuff equals diastolic one, and the blood flow is no longer obstructed, the pulsation of the vessel suddenly decreases. This moment is characterized by a marked weakening and disappearance of the tones {fourth phase).
The palpatory method is only used to take systolic pressure. As the air is released from the cuff slowly, the radial artery is palpated. When the pressure in the cuff drops slightly below the systolic one, the first weak pulse tones appear.
The oscillographic method is used to record systolic, mean, and diastolic pressure in the form of an oscillogram, and also to assess the tones of the arteries, elasticity of their wall and patency. When blood passes the compressed portion of the artery during systole, the pressure in the cuff in-
Special Part
Chapter 6. Blood Circulatory System
creases, and pressure fluctuations are recorded as a curve on a paper chart by an oscillograph. A simple oscillograph consists of a cuff, a manometer, and recording device. Pulsation of large arteries (e.g. brachial or femoral artery) is studied by oscillography. To that end, the artery in question is compressed by air which is pumped into the cuff. When the artery is compressed completely, the oscillograph only records insignificant vibrations due to the pulse thrust against the blind end of the compressed artery. The release valve is then opened and the pressure in the cuff begins decreasing. As soon as it equals the systolic pressure (to be more exact, as soon as the pressure becomes slightly lower than the systolic one), pulsations appear in the vessel wall, they are recorded as waves of small amplitude. As the pressure continues falling in the cuff, the amplitude of the waves increases. The maximum oscillations correspond to the so-called mean or dynamic blood pressure. The concept of the mean arterial pressure was formulated by I. Sechenov in 1861. According to Sechenov, this is constant pressure that might (without pulsation) ensure movement of the blood in the system at the same rate. Normal mean pressure is from 80 to 100 mm Hg. Mean pressure can only be determined from an oscillogram. It can approximately be calculated by the following formula: Pmean = Pdiastolic + i/3Ppu! se. As the pressure in the cuff further drops, the amplitude of oscillations decreases. The moment when the oscillations disappear (the last wave on the oscillogram) corresponds to the level of diastolic pressure.
Oscillograms taken at symmetrical points of the upper and lower extremities of healthy persons have a similar pattern. If patency of vessels decreases, oscillations of the affected artery decrease markedly or disappear altogether. Any indirect method of measuring systolic pressure may give somewhat exaggerated results because artificial compression of the vessel imposes additional resistance to the blood flow not only by the vascular wall itself but also the tissues surrounding the vessel. Systolic pressure may also be influenced by the hydraulic impact arising at the blind end of the artery compressed by the cuff as it meets the thrust of the pulse wave. Arterial pressure of healthy subjects varies physiologically within a certain limit depending on physical exertion or emotional strain, the posture, time of meals, and other factors. The lowest pressure is normally observed at rest, before breakfast, in the morning, i.e. in conditions under which basal metabolism occurs. This pressure is therefore called basal. When pressure is taken for the first time, it may appear slightly higher than actual which is explained by the patient's response to the procedure. It is therefore recommended that pressure be taken several times at a run without taking off the cuff but only deflating it completely. The last and the least value should be considered the closest to the true pressure. A transient increase in the arterial pressure may occur during heavy exercise
(especially in persons who are unaccustomed to it), in excitation after taking alcohol, strong tea or coffee, in heavy smoking or during attacks of intense pain.
Many diseases are attended by changes in arterial pressure. Elevation of systolic pressure over 140 mm and of diastolic over 90 mm Hg is called arterial hypertension. A drop in the systolic pressure below 100 mm and of diastolic below 60 mm Hg is known as arterial hypotension. Longstanding elevation of arterial pressure occurs in essential hypertension, many renal diseases (glomerulonephritis, vascular nephrosclerosis), in certain endocrinological diseases, and heart diseases, etc. Systolic pressure alone is sometimes elevated, whereas diastolic pressure remains normal or decreased. This causes a marked increase in the pulse pressure. This condition occurs in aortic incompetence, thyrotoxicosis, less markedly in anaemia of any aetiology and atherosclerotic affections of the vessels.
Arterial pressure may be decreased due to constitutional properties in asthenic persons, especially in the upright position (orthostatic hypotension). As a pathological symptom, hypotension occurs in many acute and chronic infectious diseases, Addison's disease, etc. A sudden drop in the arterial pressure occurs in profuse blood loss, shock, collapse, or myocardial infarction. Systolic pressure alone sometimes decreases while diastolic pressure does not change or even increases. This causes a decrease in the pulse pressure. The phenomenon is observed in myocarditis or exudative and adhesive pericarditis when cardiac output decreases to cause the corresponding fall in the systolic pressure. Pulse pressure decreases also in the presence of stenotic aortal orifice.
Pressure changes in the brachial and certain other arteries (of the lower extremities in particular) are diagnostically important. Aortic coarctation (congenital stenosis of the aorta) is characterized by considerably lower pressure in the femoral arteries compared with the brachial arteries. In order to measure pressure in the femoral artery, the cuff is placed on the thigh of the patient who is in the prone position. The pulse is auscultated in the popliteal fossa. Pressure on both arms and both legs is sometimes measured.
MEASURING VENOUS PRESSURE
Venous pressure is measured in millimetres of water column. In healthy subjects it varies from 60 to 100 mm H20. Direct and indirect phlebotonometry are used to measure venous pressure. The direct method is more accurate. The phlebotonometer is a manometer comprising a glass tube (inner diameter of 1.5 mm) fixed in a stand with a scale graduated from 0 to 350. The lower end of the glass tube is connected by rubber tub-
Special Part
Chapter 6. Blood Circulatory System
|
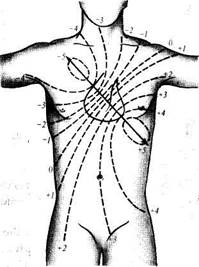
| Fig. 39. Isopotential lines of the heart's e.m.f. on the body surface. |
ing to a needle. Before measuring venous pressure, the tubes are sterilized and filled with isotonic sodium chloride solution. The level in the glass tube is adjusted to zero and the rubber tube is then stoppered by a clamp. Venous pressure is measured with the patient at complete rest in lying position. The instrument is adjusted so that the zero reading of the scale be at the level of the right atrium (at the lower edge of the pectoralis major muscle). Venous pressure in the ulnar vein is usually measured. The vein is punctured by the needle and connected to the apparatus through the rubber tube. The clothes should not compress the arm; the tourniquet on the vein should not be kept for a long time because venous congestion may influence the result of measurement. The needle is then connected to the apparatus, the pressure in the vein levelled (for 1-2 minutes), and the clamp is removed from the rubber tubing to admit the blood into the system: the column of isotonic sodium chloride solution in the glass tube reads venous pressure.
Venous pressure can be determined tentatively by raising the arm until the vein is emptied and the limb becomes pallid. The height (in millimetres) to which the arm is raised from the level of the right atrium corresponds tentatively to the venous pressure. It is pretty constant in healthy subjects at rest. Physical exertion and nervous strain can elevate the pressure. The respiratory phases have a substantial effect on venous pressure. During inspiration the intrathoracic pressure decreases to intensify the venous outflow to the heart and thus to reduce the venous pressure. During deep inspiration the pressure increases. Measuring venous pressure is important for diagnosing diseases and assessing functional condition of the cardiovascular system, especially so if this examination is carried out repeatedly.
Instrumental Study of the Heart
ELECTROCARDIOGRAPHY
Electrocardiography is a method of graphic recording of electric currents generated in the working heart. Contractions of the heart are preceded by its excitation during which physicochemical properties of cell membranes change along with changes in the ionic composition of the intercellular and intracellular fluid, which is accompanied by generation of electric current.
The heart can be regarded as a source of action current located inside a conductive body, i.e. in the human body, round which an electric field is generated. Each muscular fibre is an elementary system known as a dipole. Countless microdipoles of separate myocardial fibres make (during excitation) a summary dipole (e.m.f.) bearing a positive charge in the head and a negative in the tail. As excitation fades, the poles change places. Since excitation begins at the
heart base, this region is the negative pole, while the region of the apex—the positive pole. The electromotive force has a certain magnitude and direction, i.e. it is a vector. The direction of the electromotive force is known as the electrical axis of the heart, which is normally parallel to its anatomical axis (Fig. 39). The zero potential line is perpendicular to the electrical axis. Biocurrents of the heart can be recorded by special instruments, electrocardiographs. Development of electrocardiography is connected with the name of a Dutch physiologist Ein-thoven, who was the first in 1903 to record biocurrents of the heart by a string galvanometer. He developed some theoretical and practical principles of electrocardiography. The Russian investigator A. Samoilov, working independently and at the same time as Einthoven, developed the main principles of electrophysiology of the heart.
Construction. A modern electrocardiograph is actually a voltage measuring instrument. It includes the following parts: (1) the sensitive elements, electrodes, which are attached to the body of the patient to pick up the potential differences that arise during excitation of the heart muscle, and lead wires; (2) amplifiers, which amplify the minutest voltage of e.m.f. (1—2 mV) to the level that can be recorded; (3) a galvanometer to measure the voltage; (4) a recording instrument, including a traction mechanism and a time marker; and (5) a power unit (the instrument is supplied either from the AC mains or a battery).
Operating principle. Fluctuations in the potential difference that arise during excitation of the heart muscle are sensed by the electrodes attached to the patient's body and transmitted to the apparatus. The input voltage is extremely low, and it is therefore amplified 600-700 times. Since the magnitude and direction of the electromotive force incessantly change during the cardiac cycle, the galvanometer pointer shows variations in the voltage while a recording device draws a curve on a moving paper to show graphically these fluctuations.
The recording principle differs with various instruments. Electrocardiographs are popular in which the fluctuations are recorded on a moving tape during the measurement. These are ink-writing instruments which draw curves on paper. There are electrocardiographs in which special heat-sensitive paper is used. Dark paper is coated with a heat-sensitive layer of paraffin and chalk; the record is done by a hot stylus which removes paraffin from the col-
Special Part
Chapter 6. Blood Circulatory System
 |
|
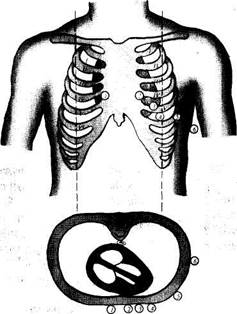
| Fig. 40. Taking ECG in chest leads; six electrode positions. |
oured supporting paper. The tape may move at various speeds, from 25 to 100 mm/s, but the speed of 50 mm/s is usually preferred. Once the speed of the tape is known, it is easy to calculate the duration of separate elements of the ECG. If an electrocardiogram is recorded at a speed of 50 mm/s, each millimetre of the curve corresponds to 0.02 second. For the sake of convenience, paper graduated in millimetres is used. If a photosensitive material is used, a special time marker makes exposures on the tape at 0.05-second intervals.
Whichever instrument is used, the sensitivity of the galvanometer is so selected that the voltage of 1 mV causes 1-cm deviation of the recording device (a beam of light, or a stylus). The sensitivity and amplification of the apparatus should be checked before recording electrocardiograms. To that end, a standardization voltage of 1 mV should be used, and this causes a 1-cm deviation of the beam or stylus. A normal one-millivolt curve looks like a square wave. The height of the vertical lines is 1 cm.
Recording ECG. Twelve-lead ECG recording has gained wide use: three standard leads (classical), six chest, and three unipolar limb leads. Special leads are also used in some cases.
Bipolar limb leads. Moist cloths are placed on the lower third of both arms and the left leg, upon which the electrode plates are then placed. The electrodes are connected to the apparatus by special wires (different in colours). The red wire with one ring is connected to the electrode on the right arm and yellow wire with two rings to the left arm electrode, and a green wire with three rings to the left leg. Three bipolar limb leads are distinguished: I, II, and III. Lead I ECG is recorded with the electrodes placed on the arms, in lead II the ECG is taken from the right arm and left leg and in lead III from the left arm and the left leg. These leads are called bipolar because two electrodes are used to record the potentials of the corresponding parts of the body. ECG taken with bipolar limb leads is the resultant of the potential difference between two points of the body. The limbs themselves act as conductors and have but little effect on the ECG.
Chest leads. For a more accurate diagnosis of various myocardial affections, ECG is recorded with leads placed on the anterior surface of the chest. The electrode is placed successively at 6 positions: (1) right sternal border, the 4th intercostal space; (2) left sternal border, the 4th interspace; (3) left parasternal line, between the 4th and 5th interspace; (4) left midclavicular line, the 5th interspace; (5) left anterior axillary line, the 5th interspace; (6) left midaxillary line, the 5th interspace (Fig. 40).
Chest leads can be uni- and bipolar. One unipolar electrode is placed on the chest, and the other on the right arm or left leg. If the second electrode is placed on the right arm, the lead is designated CR (chest, right). Depending on the position of the chest electrode, the leads are given the respective subscripts: CRj, CR2, etc. If the second electrode is placed on the left leg, the leads are designated CF (foot): CF,,, CF2, etc.
Unipolar chest leads proposed by Wilson are more popular now. The chest electrode which is attached to the positive pole of the electrocardiograph is only active; the electrodes leading from the limbs are united and connected to the negative terminal of the apparatus. With this connection, the total potential difference recorded from the limbs is practically zero. Unipolar chest leads are designated by the letter V and the position of the chest electrode is subscribed to give V,, V2, etc.
Unipolar limb leads differ from bipolar limb leads in that the potential difference in them is recorded mostly by one electrode, i.e. the active electrode, which is placed successively on the right arm, left leg, and left arm. The other electrode (as that for recording chest leads) is formed by connecting together three limb electrodes; it is indifferent. Voltage of thus recorded ECG is very small and electrocardiograms are difficult to interpret. Goldberger (1942) proposed that the active exploring limb electrode should not be connected with the other electrodes, thereby increasing the ECG voltage by 50 per cent. These leads are called augmented unipolar limb leads.
The following leads are distinguished. Right arm lead, aVR: the active electrode is located on the right arm; electrodes of the left arm and left leg are connected together to form the central terminal of apparatus, while the wire of the right arm is not connected (Fig. 41).
Left arm lead (aVL) is recorded by placing the active exploring elec-
Special Part
Chapter 6. Blood Circulatory System
|
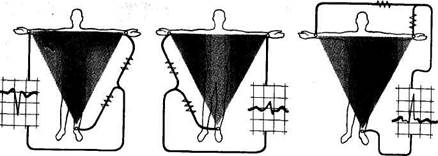
Fig. 41. Unipolar augmented limb leads. a— lead aVR; J—lead aVL; c—lead aVF.
trode on the left arm; the central electrode is formed by the electrodes of the right arm and left leg; the left arm lead is not used for the central electrode (Fig. 41).
Unipolar left leg lead (aVF) is recorded by placing the active electrode on the left leg and connecting the electrodes from the right and left arms together (see Fig. 41).
Normal ECG. During diastole the heart does not generate current and an electrocardiograph records a straight line which is called isoelectrical. Action current is represented by a specific curve. An ECG of a healthy subject has the following elements: (1) positive waves P, R, and T, negative waves Q and S; the positive wave U is accidental; (2) PQ, S-T, T-P, and R-R intervals; (3) QRS and QRST complexes. Each of these elements characterizes the time and sequence of excitation of various parts of the myocardium.
In normal conditions, the cardiac cycle begins with excitation of the atria (P wave on an ECG). The ascending portion of the P wave is mainly due to excitation of the right atrium, while the descending one of the left atrium. The wave is small, and its normal amplitude does not exceed 1-2 mm; the length is 0.08-0.1 s. The P wave is followed by a straight line lasting to Q wave; if this wave is small, the line extends to the R wave. This is the P-Q interval. It extends from the beginning of the P wave to the beginning of the Q (or R) wave and corresponds to the time from the beginning of atrial excitation to the beginning of ventricular excitation, i.e. includes the time of pulse propagation in the atria and its physiological delay in the atrioventricular node. The normal length of the P-Q interval is 0.12-0.18 s (to 0.20 s).
Excitation of the ventricles corresponds to the QRS complex. Its waves vary in size and are different in various leads. The length of the QRS complex (measured from the beginning of the Q wave to the end of the S wave) is 0.06-0.1 s. This is the time of intraventricular conduction. The first wave of this complex is the negative Q wave. It corresponds to excitation of the interventricular septum. Its amplitude is small and does not normally exceed! 4 amplitude of the R wave; the lenght of the Q wave does not exceed 0.03 s. The Q wave may be absent on an ECG. The R wave corresponds to almost complete excitation of both ventricles. It is the highest wave of the ventricular complex; its amplitude varies from 5 to 15 mm. The negative S wave is recorded in full excitation of the ventricles; usually it is not high, actually not exceeding 6 mm (2.5 mm on the average). Sometimes the S wave is very small. At the moment of complete depolarization of the myocardium, the potential difference is absent and the ECG is therefore a straight line (the S-T interval.) The length of this interval varies greatly depending on the cardiac rhythm; the S- T interval may be displaced from the isoelectric line to not more than 1 mm.
The T wave corresponds to the repolarization of the ventricular myocardium. The T wave is normally asymmetrical: the gradual ascent converts into a rounded summit, which is followed by an abrupt descent. Its amplitude varies from 2.5 to 6 mm, the length from 0.12 to 0.16 s. A small positive U wave sometimes follows the T wave in 0.02—0.04 s. Its amplitude exceeds 1 mm in rare cases: the length is 0.09—0.16 s. The origin of the U wave is disputed.
The Q-T interval (QRST complex) shows the time of excitation and recovery of the ventricular myocardium i.e. it corresponds to their electrical system. It extends from the beginning of the Q wave (or the R wave, if the Q wave is absent) to the end of the T wave. Its length depends on the rate of cardiac contractions: in accelerated heart rhythm the Q-T interval shortens. The Q-T interval in women is longer than in men (at the same heart rate). For example, at the rate of 60-80 beats per minute, the length of the Q-T interval in men is 0.32-0.37 s and in women—0.35-0.40 s.
The T-P interval (from the end of the T to the beginning of the P wave) corresponds to the electrical diastole of the heart. It is located on the isoelectric line because all action currents are absent at this moment. Its length depends on the cardiac rhythm: the faster the heart rate the shorter the T-P interval.
The R-R interval is a distance between the summits of two neighbouring R waves. It corresponds to the time of one cardiac cycle, whose length depends on the cardiac rhythm as well.. The electrocardiogram is interpreted as follows.
1. Regularity of the cardiac rhythm is first determined. Since the
Special Part
Chapter 6. Blood Circulatory System
| ^^^Pr^W |
 sinoatrial node is the pacemaker of a normal heart, and the excitation of the ventricles is preceded by excitation of the atria, the P wave should come before the ventricular complex. The R-R intervals should be equal. Its fluctuations normally do not exceed 0.1 s. Greater variations in the length of the R-R intervals indicate disordered cardiac rhythm.
2. The heart rate is calculated. To that end, duration of one cardiac cy
cle (the R-R interval) and the number of such cycles in one minute length
should be determined. For example, if one cycle lasts 0.8 s, there will be 75
such cycles in a minute (60: 0.8 = 75). If the cardiac rhythm is irregular,
the length of five or ten R-R intervals is determined, the mean R-R interval
found, and the cardiac rate is finally determined as for regular cardiac
rhythm. Lengths of the maximum and minimum R-R intervals are given in
parentheses.
3. Voltage of the ECG is determined. To that end, the amplitude of R
waves is measured in standard leads. Normal amplitude is 5-15 mm. If the
amplitude of the highest R wave does not exceed 5 mm in standard leads,
or the sum of amplitudes of these waves in all three leads is less than
15 mm, the ECG voltage is considered decreased.
4. The electrical axis of the heart is determined by the shape of ven
tricular complexes in standard leads. The relation between the electrical
axis and the magnitude of the QRS complexes in standard leads is describ
ed by the so-called Einthoven triangle. Since ECG in standard leads shows
the direction of the e.m.f. of the heart in the frontal plane, this plane can
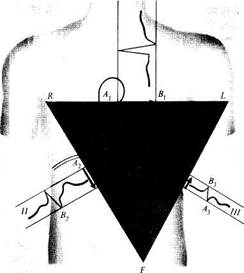
be shown as an equilateral triangle whose base is at the top (Fig. 42). The
apices of the triangle correspond to the limb leads, i.e. R for the right arm,
L for the left arm and F for the left leg (foot). The sides of the triangle cor
respond to the leads I (R-L), II (R-F), and III (L-F). The magnitude and
direction of the e.m.f. are designated by the A-B arrow. If vertical lines are
drawn from the ends of this arrow to the sides of the triangle, the dif
ference of potentials recorded in each lead can be obtained. With normal
position of the axis, the maximum potential difference will be recorded in
the second lead because this lead is parallel to the electrical axis. It follows
therefore that the maximum voltage of the ventricular complex, especially
of the R wave, will be in the same lead. A lower difference of potentials is
recorded in the first lead and still lower in lead III. Using the Einthoven
formula, it can be calculated that the magnitude of the R wave in lead II is
equal to the algebraic sum of R in leads I and III, i.e. R2 = Rx + Rv
Values of R waves with normal position of the electrical axis can be shown
as this: R2> /?, > R3 (Fig. 43).
The position of the electrical axis changes with changes of the position of the heart in the chest. If the diaphragm is low (in asthenic persons), the electrical axis is more vertical (Fig. 44). As can be seen from the Einthoven triangle, the maximum potential difference in this position will be in lead
Fig. 42. Normal position of the electrical axis of the heart.
Ill (because this lead is now parallel to the electrical axis). It follows that the highest R wave will be recorded in lead III (Fig. 45). If the diaphragm is high (in hypersthenics), the electrical axis is more horizontal, i.e. parallel to lead I (Fig. 46), and the highest R wave is therefore recorded in lead I (Fig. 47).

|
| III |
| Fig. 43. ECG in standard leads with normal position of the heart's electrical axis. |
5. The length and size of ECG elements (P wave, R-Q interval and QRST complexes) are then determined in those leads where the waves are the largest (usually in lead II). Moreover, the direction of the P and T waves is determined (they can be positive and negative). Smaller and split waves can be present as well. Additional waves can appear. The shape of

Special Part
Chapter 6. Blood Circulatory System
|
 Fig. 44. Vertical position of the heart's electrical
axis.
g. 46. Horizontal position of the heart's electrical axis.
the ventricular complex in all leads is thoroughly examined. The isoelec-trical character of the S-T interval is noted.
6. The length of the QRST complex (Q-T interval) depends on the heart rate: the higher the rate, the shorter the interval. Each particular heart rate is characterized by a certain normal lenght of the Q-T interval and the Q-T interval of a given ECG should be compared with this standard. The normal value is calculated by the formula Q-T = KJP, where K is constant (0.37 for men and 0.39 for women); and P is the length of one cardiac cycle (R-R interval) expressed in seconds. Normal Q-T lengths for any heart rate can be found in special tables.
The ECG of healthy persons depend on their age and constitution, on the posture at the moment of taking an ECG (sitting, lying), on the preceding exercise, etc. ECG may change during deep breathing (the position of the heart in the chest is changed during deep inspiration and expiration), in increased tone of the sympathetic and parasympathetic nervous systems and in some other conditions.
It is difficult to overestimate the clinical importance of electrocar-diography. It is used to reveal disorders of heart activity, and to diagnose coronary circulatory disorders. ECG can reveal enlargement of heart chambers. If the atrium is enlarged and its myocardium is hypertrophied,
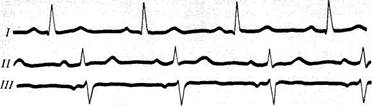
Fig. 45. ECG in standard leads with the vertical position of the heart's electrical axis.
Fig. 47. ECG with the horizontal position of the heart's electrical axis.
Special Part
Chapter 6. Blood Circulatory System
the P wave changes. Since an enlarged atrium is slower excited, the length of the P wave becomes longer than 0.1 s. The amplitude of the P wave increases because a higher potential is generated to excite the large mass of the myocardium. If dystrophic or sclerotic changes occur in the myocardium, the shape of the P wave changes: it becomes serrated and split (with two phases). Enlargement of the left atrium changes the P wave in standard leads I and II. Enlargement of the right atrium changes the P wave in standard leads II and III. Ventricular hypertrophy causes the following changes in ECG: (1) the position of the electrical axis is changed: in left-ventricular hypertrophy it deviates to the left, and in right-ventricular hypertrophy to the right; (2) the amplitude of the ventricular complex and its length increase, i.e. the time of excitation of the ventricles increases; (3) the recovery of the myocardium is upset and this shows itself in the changed terminal part of the ventricular complex of the ECG, namely, the S-T segment is displaced and the T wave changes; (4) in left-ventricular hypertrophy, the amplitude of the S wave in the right chest leads increases: the amplitude of the R wave in the left chest leads increases too. In right-ventricular hypertrophy the changes in the S and R waves are the reverse, i.e. a high R wave appears in the right chest leads, and a deeper S wave in the left leads.
Electrocardiography helps reveal dystrophic and sclerotic changes in the myocardium. ECG changes also in abnormalities of electrolyte metabolism, due to various toxic substances or certain medicines (e.g. quinidine, digitalis, etc).
However informative the ECG findings may be, they are only useful when correlated with the clinical data, since various pathologies can give similar ECG. Underestimation of the clinical data and overestimation of electrocardiography may cause serious diagnostic errors.
Electrocardiography is used for functional examination of the cardiovascular system. Combination of electrocardiographic studies with functional tests helps reveal latent coronary insufficiency and differentiate between functional organic disorders. Differential diagnosis is now widely used not only in clinical practice but also in sports medicine, occupational orientation, etc.
Exercise testing is commonly used. The patient is placed in the lying position and a 12" -lead ECG taken at rest. The patient is then asked to perform exercise, e.g. change his position (sit up), squat, ascend and descend stairs, etc. A special two-step exercise test is used: the patient is allowed to walk up and down a special pair of 22.5-cm-high steps for 1.5—3 minutes, and ECG are then taken—immediately after the exercise, and in 3 and 6 min. The test is used to reveal latent coronary insufficiency, the signs of which can be detected on the ECG after exercise. A bicycle ergometer is now also used. The patient is asked to rotate pedals, like in riding a bicycle, the resistance to pedalling being controlled. Treadmills are also used for the purpose. Similar examinations of patients can be done with hypoxaemic tests, in which air containing only 10 per cent of oxygen is inhaled for 10—20 minutes with subsequently recorded ECG, which also reveals latent coronary insufficiency.
Telecardiography (radioelectrocardiography) is now also used to study the effects of
physiological stress imposed on the heart. The electric currents of the heart are transmitted by a radio device attached to the examinee and the ECG is thus recorded at a distance from the patient. This method is very useful for taking ECG during exercise, (sportsmen, astronauts, pilots).
Pharmacological tests are used to differentiate between functional and organic disorders in coronary circulation. Amyl nitrite and nitroglycerin are used for the purpose. The original ECG is compared with ECG taken after amyl nitrite or nitroglycerin intake. Disappearance of signs of myocardial ischaemia after taking vasodilatory preparations indicates the functional character of coronary disorders, federal and potassium chloride are used to differentiate between neuroendocrine and metabolic disorders and coronary insufficiency in cases with changed terminal part of the ventricular complex (S-T interval and T wave). These preparations remove mainly metabolic and functional changes.
Tests by which the tone of the vagus nerve is modified are used to assess some disorders of the cardiac rhythm.
Aschner's test. Pressure on the eyeball for 6-10 s increases the tone of the vagus to increase its effect on the heart: the heart slows down and the time of the atrioventricular transmission increases. If an attack of paroxysmal tachycardia occurs during the Aschner test, the sinus rhythm can be restored.
Atropine test. The subject is given 1 ml of a 0.1 per cent atropine solution by a subcutaneous injection, and ECG are then taken in 5, 15, and 30 minutes. Atropine blocks the vagus and thus provides conditions for a better interpretation of disorders in the cardiac rhythm and transmission. If, for example, the P-Q interval on the pre-injection ECG was elongated but normalized after administration of atropine, the disorder in the atrioventricular transmission was due to the increased vagus tone and not due to an organic myocardial affection.
VECTORCARDIOGRAPHY
Electrocardiography cannot completely show the entire complexity of electrical phenomena occurring in the myocardium because it only shows changes in the electrical field in one plane. Since the heart is a three-dimensional organ, its electrical field in three-dimensional space should be examined. The method of study of the heart's electric field in three planes is called vectorcardiography. It has already been said that the e.m.f. of the heart has a certain magnitude and direction. In other words it is a vector, and is therefore indicated by an arrow whose length corresponds to the magnitude of the e.m.f. At any given moment of the cardiac cycle, a specific resultant potential difference arises. It has its own magnitude, direction, which is called instantaneous vector. If the.ends of instantaneous vectors originating from one point are connected with one another, a closed curve is obtained, which is called vectorcardiogram (VCG). These curves can be obtained for excited atria (loop P corresponds to the P wave on an ECG), ventricles (QRS loop), and recovered ventricular myocardium (loop T). A special apparatus, vectorcardiograph, is used to take vectorcardiograms. A cathode-ray tube is the main part in this apparatus.
BALLISTOCARDIOORAPHY
A method for recording the body's mechanical movements resulting from the beating heart as it ejects blood into the aorta and the pulmonary trunk. The amount of displacement of the body in each cardiac cycle is informative of the myocardial contractile function.
Three main forces are generated by the working heart: (1) ejection of the blood from the ventricles to the vessels is attended by a thrust (like a recoil force in firing a gun) which is transmitted to the body; (2) movement of blood in the vessels displaces the body in the direc-
Special Part
Chapter 6. Blood Circulatory System
tion of the blood flow; (3) when the blood stream meets an obstacle to its flow (a bend or bifurcation of the vessel), the body moves in the opposite direction. These mechanical movements of the body can be recorded by a ballistocardiograph in the form of a curve known as a ballistocardiogram (BCG). Depending on the design, ballistocardiographs can record one of the three parameters characterizing any mechanical movement; these are (1) the amount of displacement, i.e. the distance to which the body travels from its initial position to the final one; (2) the speed of displacement (the velocity in centimetres per second); and (3) acceleration (the change in the velocity per unit time).
Ballistocardiographs of various designs are available but all of them utilize one operating principle, that is they perceive mechanical vibrations of the human body caused by the beating heart, convert them into electrical pulses, amplify and transmit them to the recording apparatus. Any electrocardiograph can be used to record ballistocardiograms.
A normal BCG is a record of successive waves that are generated during each cardiac cycle. These waves are designated by the Latin letters from F to O. BCG waves are related to one another in certain order with respect to their magnitude and length. Differentiated are the systolic complex (waves H, I, J, and K) and the diastolic complex (waves L, M, N, and O). The H wave arises 0.04-0.06 s after the R wave on an ECG. It is due to the thrust of the heart from the rising atrioventricular septum at the beginning of the isometric phase of the ventricular systole. The / wave follows the R wave in 0.12—0.15 s. It is associated with the recoil force generated during ejection of blood from the ventricles into the vessels. The / wave appears 0.2 s after the R wave on an ECG and shows the thrust of the blood stream against the aortic arch and the bifurcation of the pulmonary trunk artery. This is the highest wave of the systolic complex. Wave K corresponds to the blood flow along the descending part of the aorta. Diastolic waves L, M, N, and O are connected with flow of blood to the heart and its filling. Normally they are small and inconstant; the highest of them is the L wave. The systolic wave H is sometimes preceded by the G wave, which is due to the atrial systole. The amplitude of BCG waves varies within wide limits depending on the respiratory phases: during inspiration the amplitude increases and during expiration decreases.
In pathological conditions the shape, length and amplitude of BCG waves change, and the respiratory fluctuations of the waves are altered too. BCG is especially helpful in follow-up studies. Changes associated with coronary insufficiency, for example, can be earlier revealed on ballistocardiograms than on electrocardiograms (exercise test).
ECHOCARDIOGRAPHY
Echocardiography is used to study the heart by detecting ultrasound echoes from its various structures, such as the valves, ventricular myocardium, interventricular septum, etc. The instrument used for the purpose is known as the echocardiograph. It emits ultrasound impulses which are returned from the organ under examination and received as echoes to be represented graphically on a moving paper chart, the echocardiograms.
The device emitting ultrasound impulses (the probe) is placed in the region of absolute dullness where the heart is not covered by the lungs, i.e. to the left of the sternum at the 2nd or 3rd intercostal space in hypersthenics and 4th or 5th interspace in asthenics.
Echocardiography is very useful for the diagnosis of various heart diseases since it determines the condition of the heart valves and reveals
hypertrophy and dilatation of the heart chambers. Echocardiography can be used to diagnose prolapse of the mitral valve, to evaluate the condition of the myocardium in various disease, e.g. in ischaemic heart disease, myocarditis, or congestive cardiomyopathies, to diagnose subaortic stenosis, to reveal the presence of fluid in the pericardium, etc.
If the anterioposterior dimensions of the left ventricle during systole and diastole are known, it is possible to determine the stroke volume and other indices characterizing contractility of the left ventricular myocardium.
PHONOCARDIOGRAPHY
This is the method for recording sounds generated in the beating heart. Phonocardiography is an essential supplement to heart auscultation because it can record sounds otherwise inaudible to the human ear, such as the third and fourth heart sounds, low-frequency components of the first and the second heart sounds, and low-frequency murmurs.
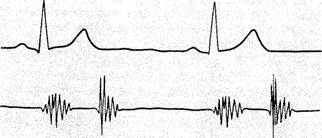
Sounds generated in the heart are recorded on a phonogram as a curve (PCG) by an apparatus known as a phonocardiograph. It consists of a microphone, an amplifier, a system of sound filters, and a recording device. The microphone picks up sounds and converts them into electrical signals. These are amplified and transmitted into the system of sound filters where the sounds are separated by their frequencies (low, medium-and high-frequency sounds) for their separate recording. Oscillations of a certain frequency are transmitted to the recording device which draws a curve. A phonogram can be recorded by ink on a chart paper, or by a beam of light (on a photosensitive paper). Phonocardiograms are taken in complete silence with the patient in the lying position; the breath should be kept at the expiration phase. The microphone is placed successively on those sites of the chest where heart sounds are audible during auscultation, and also on those areas where the sounds can be heard best. Phonocardiograms should be analysed and diagnosis established only by interpreting the phonocardiogram together with the auscultation findings. For a better interpretation of phonocardiograms, an electrocardiogram should be taken synchronously.
A normal phonocardiogram gives a graphic picture of vibrations caused by the first and second heart sounds, with a straight line in between, corresponding to the systolic and diastolic pauses (Fig. 48a and b). The first sound is represented as several vibrations arising after the Q wave synchronously with the ECG (70-150 Hz). The initial vibrations of the first sound have a low amplitude; these are connected with atrial systole. The main or central part of the first sound is shown in the form of 2-3 vibrations of high amplitude, which are found at the level of the S wave and cor-
Special Part
Chapter 6. Blood Circulatory System

|
|
| ■ Hlfr—%~— |
| ------ -AJ^f------- ^U |
| --------- v^Jlw------ (L, |
^ —|w—
II
Fig. 48. Normal PCG. a—at the heart apex; b— at the heart base.
respond to vibrations of closed atrioventricular valves. The main portion of the first sound is followed by additional vibrations of lower amplitude which are caused by vibrations of the myocardium and by the vascular component.
The amplitude of sound waves on a PCG depends not only on the work of the heart but also on the conditions of sound conduction (for example, the amplitude decreases in patients with obesity or lung emphysema).
The amplitude of the first sound is the highest at the heart apex, where it exceeds 1.5-2 times the amplitude of the second sound. The amplitude of the first sound at the heart base can be very small. While interpreting this sound at the heart apex, it is necessary to determine the lag of its central portion from the Q wave on a synchronously recorded ECG. The normal Q-l sound interval does not exceed 0.04-0.06 s. It corresponds to the time lasting from the beginning of ventricular excitation to the closure of
the mitral valve. If pressure in the left atrium increases (e.g. in mitral stenosis), the mitral valve closes with a delay and the Q-l sound interval increases.
The second sound is composed of several vibrations which appear at the end of the T wave synchronous with ECG. Its frequency varies from 70 to 150 Hz. Higher amplitude corresponds to the closure of the aortic valve, while subsequent lower amplitude corresponds to the closure of the valve of the pulmonary trunk. The amplitude of the second sound is the highest at the base of the heart, where it exceeds the amplitude of the first sound.
In addition to the first and second sounds, a phonocardiogram often has the third heart sound which is recorded as two or three low-frequency waves of small amplitude. They follow the second sound in 0.12-0.18 s and appear before the P wave of a synchronous ECG. The fourth heart sound is recorded less frequently. It has the form of one or two low-frequency low-amplitude waves appearing after the P wave.
Phonocardiography helps diagnose many cardiovascular diseases, heart defects in the first instance. It verifies and supplements auscultative findings. This is especially important in tachycardia or arrhythmias, i.e. in cases where it is difficult to establish by auscultation alone during which phase of the cardiac cycle the sounds appeared. PCG helps reveal changes in the heart sounds, their duplication, splitting, and ensures a more correct interpretation of additional sounds, such as physiological third and fourth heart sounds, the sound of the opening of the mitral valve, and the gallop rhythm. Phonocardiograms show graphically the changes in the heart sounds that were first revealed by auscultation. For example, in stenosis of the left venous orifice the amplitude of the first sound at the apex markedly increases, and in mitral valve incompetence it decreases. The amplitude of the second sound over the aorta in patients with essential hypertension is higher than over the pulmonary trunk.
The sound of the opening of the mitral valve, usually designated OS (opening snap), is very important in diagnosis of mitral stenosis. As distinct from the third heart sound, it is recorded in the high-frequency channel, 0.04-0.12 s after the second heart sound. This II sound-OS interval (like the Q-l sound interval) depends on the pressure in the left atrium: the higher the pressure, the earlier opens the mitral valve during diastole, and the shorter the II sound-OS interval will be.
Phonocardiography is very helpful in interpreting the character of heart murmurs; PCG determines the time of appearance of murmur, site of its maximum intensity, length, and frequency (which is determined mainly by the sound intensity as recorded in the high- or low-frequency channel). The frequency of systolic sound usually varies from 50 to 600 Hz and of
Special Part
Chapter 6. Blood Circulatory System
|
| tongue % |
diastolic from 120 to 800 Hz. Murmurs are shown on a PCG as a group of oscillations of various amplitude (depending on the murmur intensity) which appear during the systolic or diastolic pause.
The systolic murmur may last during the entire systole or only during its part, or it may be between the first and the second heart sound, or else it may combine with them. Attention is paid.to the wave form of systolic murmur, which may be rhomboid, spindle- or band-shaped. This is important for diagnosing heart defects. Rhomboid or spindle-shaped waves of the systolic murmur (not combined with the second heart sound) are characteristic of stenosed aortic orifice.
When evaluating diastolic murmur, it is important to determine the moment of diastole at which it appears (i.e. to establish whether the murmur is protodiastolic, mesodiastolic or presystolic). The change in the murmur intensity is then determined (decreasing or increasing murmur); next the frequency characteristics of the murmur are determined. Diastolic murmur in aortic insufficiency is better recorded in the high-frequency channel, while in mitral stenosis in the low-frequency one.
The various frequency characteristics of murmurs, different time of their appearance during the course of a given phase of the cardiac cycle help diagnosing combined affections of the heart valves. Phonocar-diograms in heart diseases will be discussed later in the section " Heart Diseases".
FUNCTIONAL TESTING OF THE CIRCULATORY SYSTEM
Blood flow rate is determined by the time during which blood passes a certain length of the cardiovascular system and mainly depends on myocar-dial contractile power and the condition of the peripheral vessels. The amount of the circulating blood and its viscosity are also important. When blood flow rate is determined, substances are used which cause a biological response (e.g. dilatation of the vessels or alteration of respiration), or can easily be determined in the blood (radioactive isotopes or stains). These substances should not be toxic, nor should they affect the flow rate. The action of such a substance on man should only be transient.
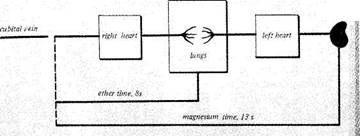
Magnesium sulphate test. Magnesium sulphate (1 ml of a 50 per cent or 2 ml of 25 per cent solution) is injected into the cubital vein of the patient. The injection should be quick, and the time of injection should be marked by a stop-watch. As magnesium sulphate solution passes the vessels of the lesser circulation, it enters the greater circulation to dilate capillaries. The subject feels warmth, first in the mouth and then in the entire body and the limbs. The moment when the patient feels the warmth in the mouth is noted by the stop-watch (Fig. 49). The normal time, as determined by this
Fig. 49. Determining circulation time.
method, is 10—15 s. The same method can be carried out with calcium chloride. Decholin or saccharine is sometimes injected into the vein. The time of appearance of bitter or sweet taste in the mouth is determined by a stop-watch.
Ether test. This is used to assess the state of the circulatory system over a shorter length (from the cubital vein to the pulmonary alveoli). A dose of 0.3 ml of sterile ether is injected into the cubital vein and the time when an ether breath appears is noted (arm-to-lung time). The normal time is 4—8 s.
Lobeline test. This is a more objective test. Intravenous administration of a 1 per cent lobeline solution (0.1 mg/kg body weight) causes a transient dry cough or dyspnoea the time of appearance of which is determined by a stop-watch. The changes in respiration are due to irritation of the pulmonary branches of the vagus. Respiratory movements can synchronously be recorded by a kymograph. Normal " lobeline time" is 8-10 s.
A number of other methods for assessing blood-flow rate are based on determining the degree of dilution of stains added to the blood. For example, 2 ml of a 20 per cent fluoresceine is injected into the cubital vein and the time when the lip mucosa becomes greenish-yellow is determined by a stop-watch. The normal time is 12-16 s. Time of blood circulation over longer paths, using fluoresceine (to the cubital vein of the other arm), can be determined by taking blood samples from the vein of the other hand at 5-second intervals. Normal arm-to-arm time is 15-30 s.
Radioisotope method. Circulation time can be determined by injecting isotopes (^Na, 131I, 85Kr) intravenously and detecting them by a special counter at any given point of the vascular system.
Oxyhaemography. This method can also be used for determining blood circulation time. The sensitive unit of an oxyhaemograph includes a photocell which detects changes in the colour of the blood depending on its oxygen content. The pick-up is attached to the lobe of the ear, where it records blood oxygen saturation. The respiratory movements are recorded synchronously. After the initial blood oxygen content has been determined, the patient is asked to keep breath for 10—15 s, which reduces the oxygen concentration in the blood. The patient
Special Part
Chapter 6. Blood Circulatory System
 then makes a deep inspiration and the recording device of the oxyhaemograph records the increase in the oxyhaemoglobin content of the blood. The records of the respiratory movements are then compared with the oxygen curve, and the time from the beginning of the deep inspiration to the increase in oxyhaemoglobin content is calculated. This is the ear-to-lung circulation time.
Whichever method is used for determining the circulation time, the results are not absolutely accurate. In physiological conditions, the circulation time increases with exercise or temperature, and slows down with decreasing temperature and in the middle-aged persons. In pathology, the blood-flow rate increases in fever, thyrotoxicosis, and anaemia. Determining increased blood-flow rate is very important in congenital heart defects because it indicates the presence of communication between the right and left chambers of the heart (in defects of interatrial or interventricular septum). The flow rate slows down in decreased contractile power of the heart and disordered circulation, especially in congestion in the lesser circulation (decompensated heart defects, myocardial infarction, etc.).
Systolic and minute volumes of blood. Systolic (stroke) volume of blood is the amount of blood that is ejected by the heart per each contraction. The normal systolic volume varies from 50 to 75 ml. The minute volume is the amount of blood pumped by the heart during one minute. Normally it is 3.5-8 1 (at rest).
In clinical practice, only the minute volume of blood is determined, while the stroke
volume is calculated by dividing the minute volume by the number of heart beats per minute.
The most accurate method is based on Fick's principle. According to this method, the amount
of substance delivered to the blood during one minute and the increase of its concentration in
the blood are determined. The oxygen (O) concentration in the blood passed through the
pulmonary vessels increases by the value which is determined as the arterio-venous oxygen dif
ference (A — B). Once the total oxygen consumption during one minute is known (determin
ed by the oxygen deficit in the expired air) and the arterio-venous oxygen difference is deter
mined, the minute volume (MV) can be found from the formula: MV = —. The method
A — B
is complicated, because in order to determine the oxygen concentration in the blood it is necessary to puncture the artery, and for obtaining specimens of the arterio-venous blood, the heart's right chambers should be catheterized. This method is therefore only used in patients in whom the heart is catheterized for diagnostic purposes.
Indirect methods (radioisotopic and stain dilution) for determining minute volumes are more popular. The patient is given stain intravenously (Evans blue) or substances labelled by radioactive isotopes; their concentrations in the arterial blood are then measured. Once the amount of the injected substance, its concentration in the blood, and the time of passage through a given length of the circulatory system are known, the minute volume can be calculated by special formulas.
The minute volume depends on sex, age, ambient temperature, and some other factors. The minute volume increases markedly during heavy exercise. Well-trained athletes may have minute volumes as high as 40 1 which is mainly due to the increased stroke volume (to 150-200 ml).
The minute volume increases in lung emphysema, anaemia, and thyrotoxicosis. It decreases in cardiac insufficiency (sometimes to 2—1.5 1), decompensated heart diseases, myocardial infarction, myocarditis, and some other diseases.
Determining the volume of circulating blood. Stains and radioactive isotopes are mostly used to determine the volume of circulating